Business Intelligence Reports
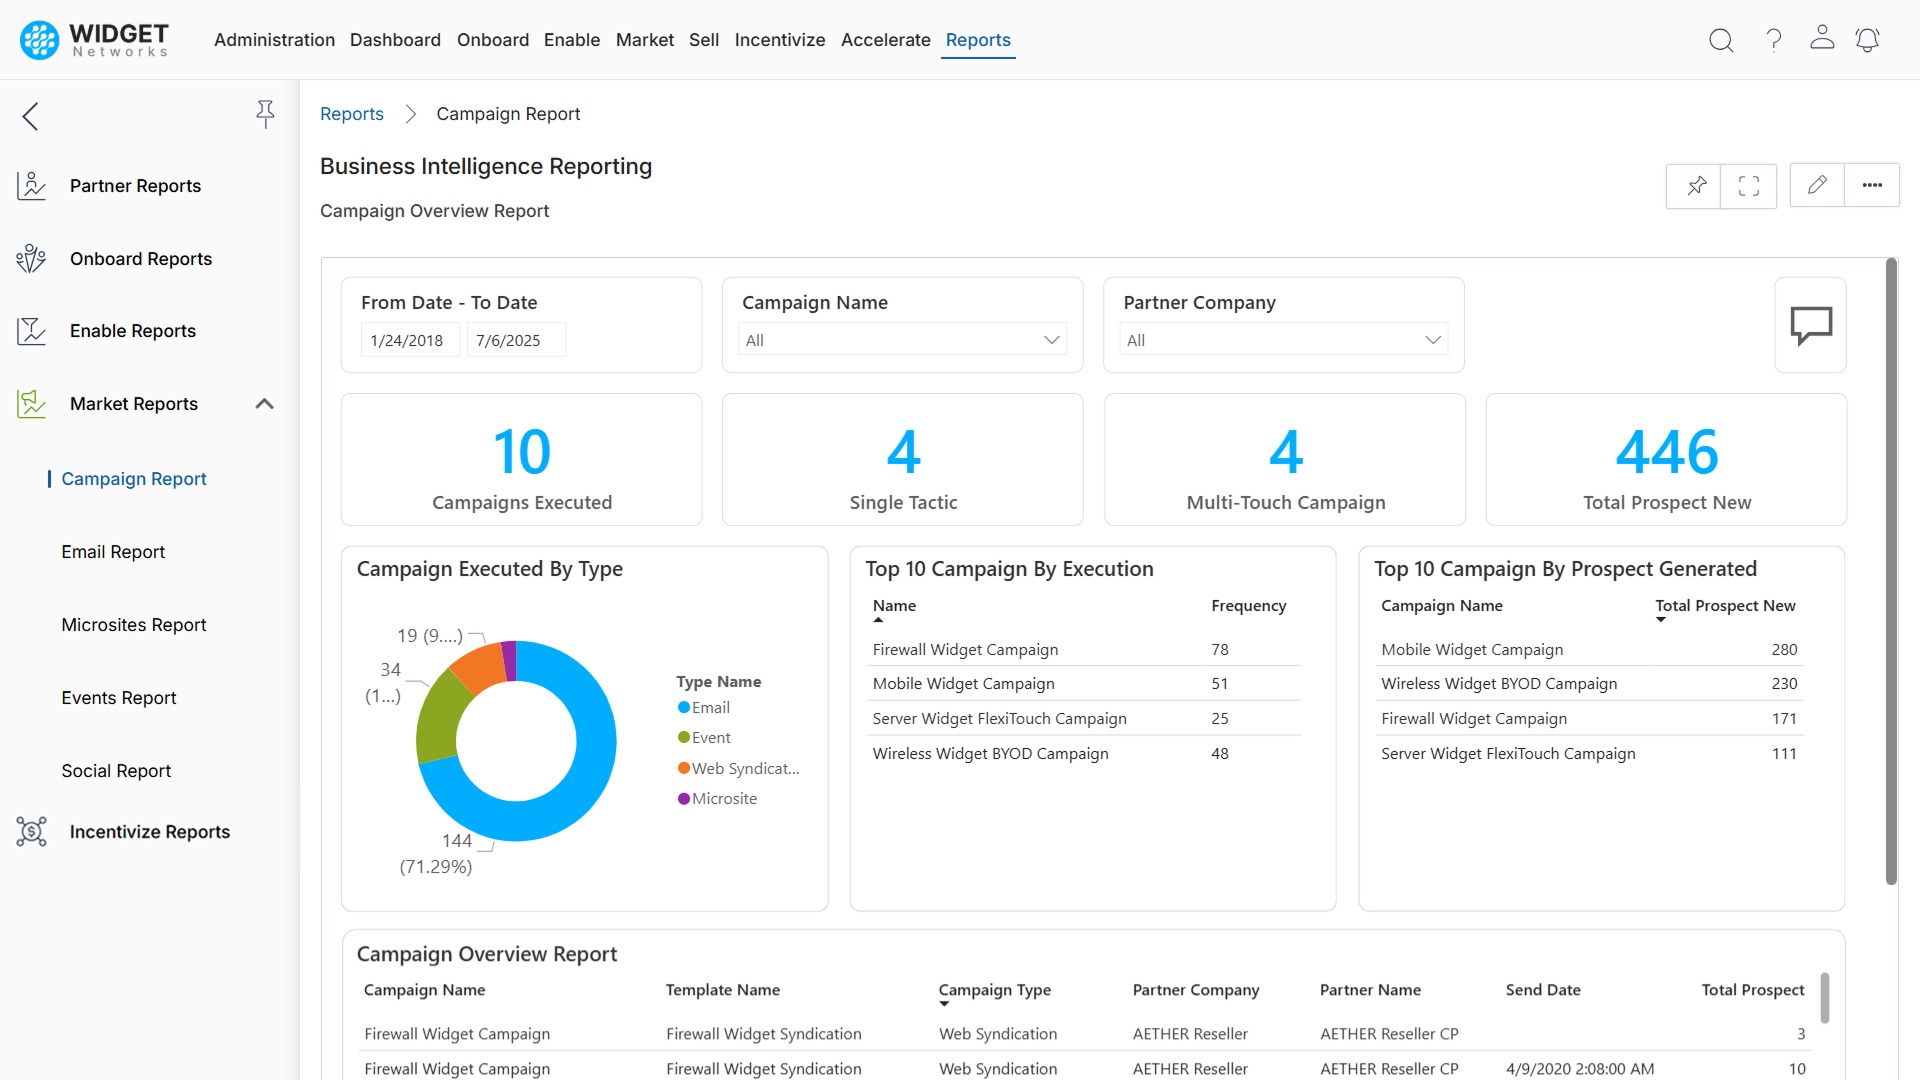
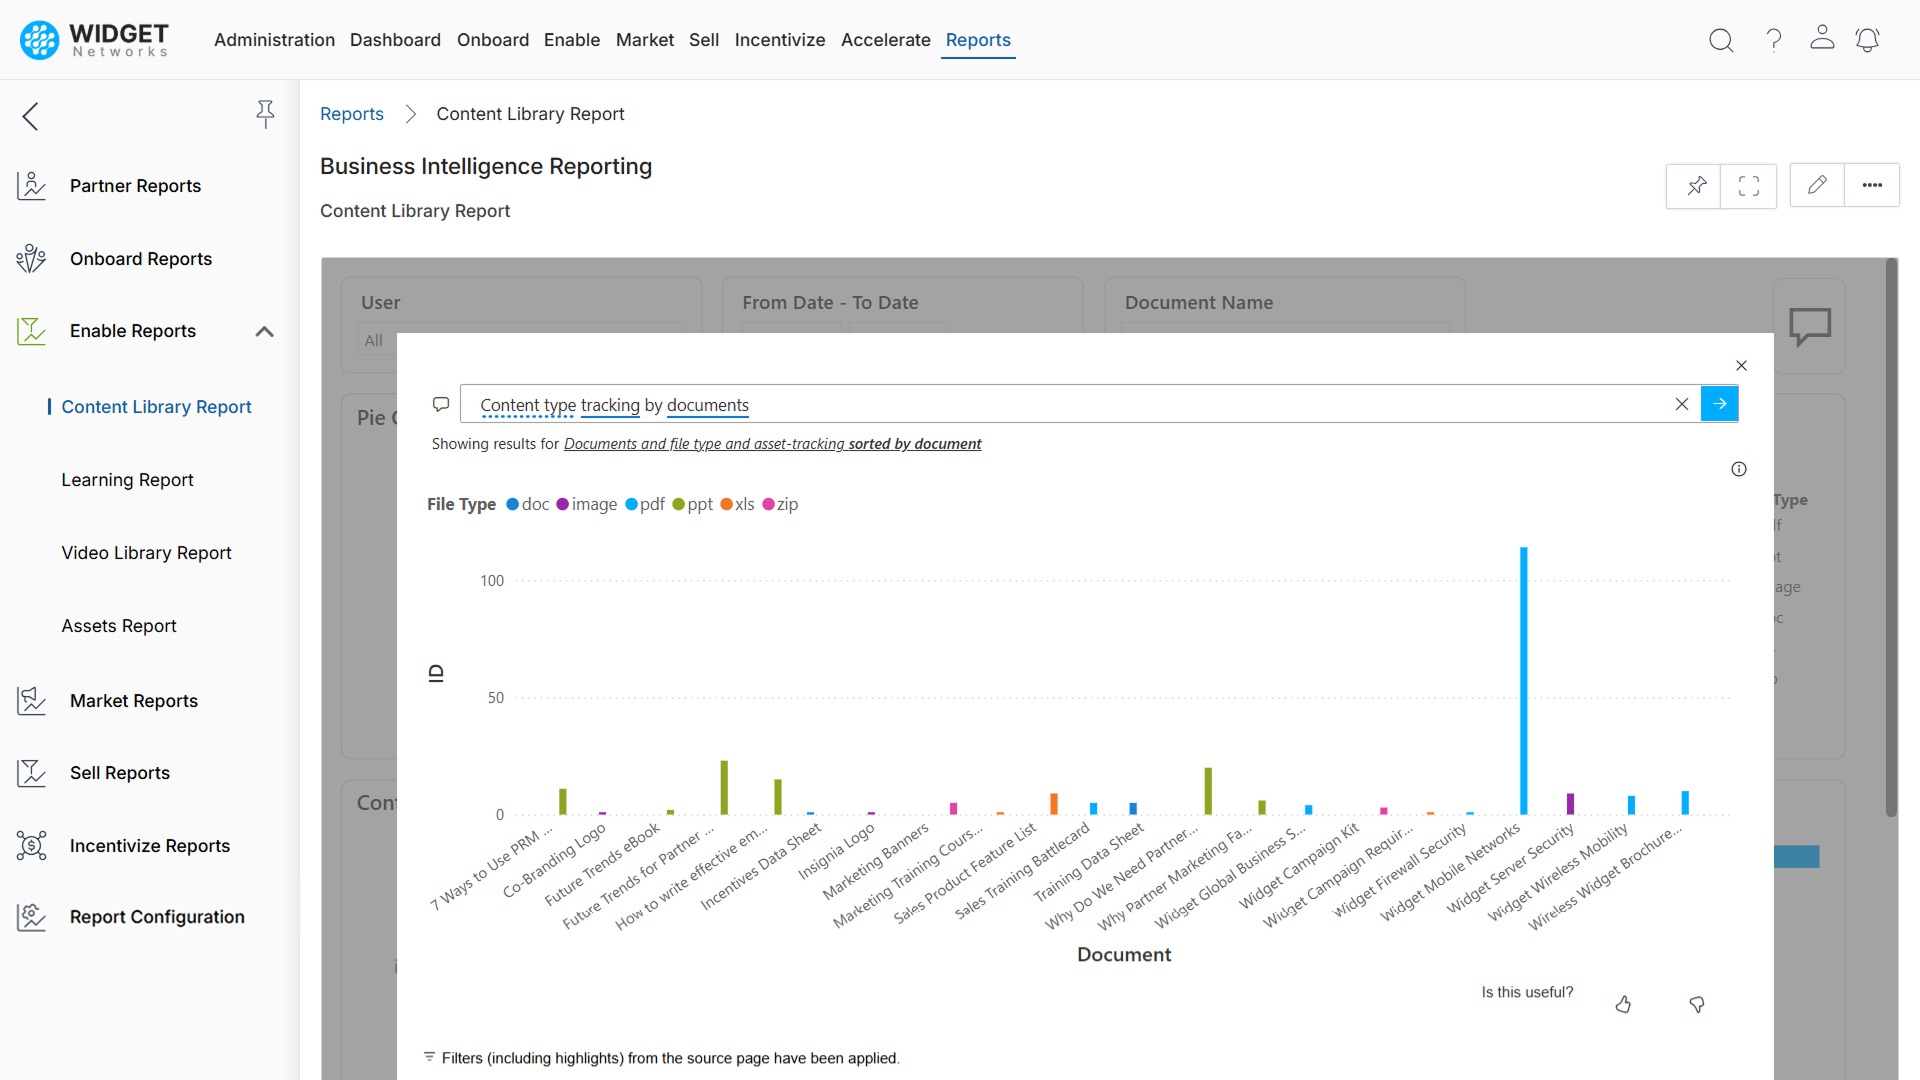
Centralized Report Generation
Easily generate and manage a wide variety of reports from a single, centralized platform that is designed for efficiency and flexibility.
- Create and save custom reports by adding/removing fields.
- Export reports (PDF, PPT) for easy sharing and distribution.
- Embed reports into Dashboards using the ZINFI CMS Editor.
This streamlined approach enables you to quickly access the data you need to monitor performance and make informed decisions.
Partner Analytics Report
Track and analyze partner performance with a variety of reports that provide deep insights into their activities and engagement.
- View partner details, activity, and overall performance.
- Track how partners use the portal and its modules.
- Analyze partner participation in programs and campaigns.
These reports empower you to identify top-performing partners and optimize your partner programs for maximum engagement. Partners also have access to these reports, but only for their individual data.

Market Reports
Measure the effectiveness of your marketing initiatives with reports that provide insights into campaign performance and asset usage.
- Campaign Report shows status, budget, and effectiveness.
- Email Report tracks opens, clicks, and bounce rates.
- Social Report analyzes views, clicks, and engagement.
These insights help you optimize your marketing strategy and prove the value of your channel marketing efforts.


Sell and Incentivize Reports
Monitor sales performance and track incentive payouts with reports that provide a clear view of your revenue pipeline and partner earnings.
- Prospect reports show prospect status, age, and engagement.
- Pipeline reports track the entire sales pipeline process.
- Incentive reports analyze commissions, rebates, and MDF payouts.
These reports empower you to make data-driven decisions about your sales and incentive strategies.
Power BI Q&A AI Functionality
The platform leverages Microsoft Power BI’s Q&A AI functionality to provide a natural language querying experience for all reports.
- Ask conversational questions for immediate data answers.
- AI converts questions into visual charts or reports.
- All users get instant insights without complex reports.
This AI functionality simplifies data analysis, making it accessible to a broader range of users and accelerating decision-making.


